e. Setup monitoring
In this section, you will learn how to monitor your cluster and the pods running on it.
There are several ways to set up monitoring. You will walk through two approaches in order to learn about simple built-in command line-based monitoring as well as comprehensive graphical dashboard-based monitoring.
1. Monitor using kubectl
This method allows viewing of cluster-wide metrics in textual form.
1.1. Deploy metrics server
To enable utilization monitoring of the cluster using kubectl, deploy the Kubernetes metrics server by executing the following command:
kubectl apply -f https://github.com/kubernetes-sigs/metrics-server/releases/latest/download/components.yaml
Please allow 1 to 2 minutes for the metrics server to initialize, then proceed to the next step. If you execute the next step and see an error instead of the expected output, please wait a few more seconds and retry.
1.2. Execute kubectl
To see node utilization of your cluster, execute:
kubectl top node --use-protocol-buffers
Sample output:
NAME                                           CPU(cores)   CPU%   MEMORY(bytes)   MEMORY%
ip-192-168-86-187.ec2.internal                 201m         0%     1362Mi          0%
To see how much resources each pod is utilizing, execute:
kubectl top pod -A --use-protocol-buffers
Sample output:
NAMESPACE      NAME                                            CPU(cores)   MEMORY(bytes)
kube-system    aws-node-crzgq                                  6m           83Mi
kube-system    aws-node-qjx2h                                  4m           81Mi
kube-system    coredns-f47955f89-dsrjp                         3m           27Mi
kube-system    coredns-f47955f89-vvvn4                         3m           26Mi
kube-system    fsx-csi-controller-78b5599496-2992k             9m           80Mi
kube-system    fsx-csi-controller-78b5599496-5gf5k             5m           66Mi
kube-system    fsx-csi-node-bxjzc                              2m           53Mi
kube-system    fsx-csi-node-qs9dh                              8m           52Mi
kube-system    kube-proxy-l6747                                11m          52Mi
kube-system    kube-proxy-ntjf7                                13m          51Mi
kube-system    metrics-server-64cf6869bd-b9lsg                 5m           28Mi
2. Monitor using Prometheus and Grafana
This approach allows cluster-wide monitoring through a web-based graphical user interface.
2.1. Add helm repositories
Add the Prometheus and Grafana helm repositories by executing the following commands:
# add prometheus Helm repo
helm repo add prometheus-community https://prometheus-community.github.io/helm-charts

# add grafana Helm repo
helm repo add grafana https://grafana.github.io/helm-charts
2.2. Deploy Prometheus
The Prometheus server collects and exports cluster metrics. Execute the following commands to deploy it:
kubectl create namespace prometheus

helm install prometheus prometheus-community/prometheus \
    --namespace prometheus \
    --set alertmanager.persistentVolume.storageClass="gp2" \
    --set server.persistentVolume.storageClass="gp2"
To verify the deployment, execute:
kubectl get all -n prometheus
The expected output looks similar to this:
NAME                                                READY   STATUS    RESTARTS   AGE
pod/prometheus-alertmanager-6f64cb4659-wkbj5        2/2     Running   0          107m
pod/prometheus-kube-state-metrics-77ddf69b4-z8z4z   1/1     Running   0          107m
pod/prometheus-node-exporter-lm4rt                  1/1     Running   0          107m
pod/prometheus-node-exporter-r4hbp                  1/1     Running   0          107m
pod/prometheus-pushgateway-5f7dcb67bb-b4z5k         1/1     Running   0          107m
pod/prometheus-server-584d5c7c84-gmf4z              2/2     Running   0          107m

NAME                                    TYPE        CLUSTER-IP      EXTERNAL-IP   PORT(S)    AGE
service/prometheus-alertmanager         ClusterIP   10.100.15.106   <none>        80/TCP     107m
service/prometheus-kube-state-metrics   ClusterIP   10.100.38.71    <none>        8080/TCP   107m
service/prometheus-node-exporter        ClusterIP   10.100.28.205   <none>        9100/TCP   107m
service/prometheus-pushgateway          ClusterIP   10.100.76.25    <none>        9091/TCP   107m
service/prometheus-server               ClusterIP   10.100.103.56   <none>        80/TCP     107m

NAME                                      DESIRED   CURRENT   READY   UP-TO-DATE   AVAILABLE   NODE SELECTOR   AGE
daemonset.apps/prometheus-node-exporter   2         2         2       2            2           <none>          107m

NAME                                            READY   UP-TO-DATE   AVAILABLE   AGE
deployment.apps/prometheus-alertmanager         1/1     1            1           107m
deployment.apps/prometheus-kube-state-metrics   1/1     1            1           107m
deployment.apps/prometheus-pushgateway          1/1     1            1           107m
deployment.apps/prometheus-server               1/1     1            1           107m

NAME                                                      DESIRED   CURRENT   READY   AGE
replicaset.apps/prometheus-alertmanager-6f64cb4659        1         1         1       107m
replicaset.apps/prometheus-kube-state-metrics-77ddf69b4   1         1         1       107m
replicaset.apps/prometheus-pushgateway-5f7dcb67bb         1         1         1       107m
replicaset.apps/prometheus-server-584d5c7c84              1         1         1       107m
2.4. Deploy Grafana
The Grafana server displays metrics from Prometheus as graphical dashboards.
First create a data source manifest for Prometheus:
mkdir ${HOME}/environment/grafana

cat << EoF > ${HOME}/environment/grafana/prometheus.yaml
datasources:
  datasources.yaml:
    apiVersion: 1
    datasources:
    - name: Prometheus
      type: prometheus
      url: http://prometheus-server.prometheus.svc.cluster.local
      access: proxy
      isDefault: true
EoF
Deploy Grafana and configure it with Prometheus as the data source:
kubectl create namespace grafana

helm install grafana grafana/grafana \
    --namespace grafana \
    --set persistence.storageClassName="gp2" \
    --set persistence.enabled=true \
    --set adminPassword='SC22!sAWSome' \
    --values ${HOME}/environment/grafana/prometheus.yaml \
    --set service.type=LoadBalancer
To verify the deployment, execute:
kubectl get all -n grafana
The expected output looks similar to the following:
NAME                          READY   STATUS    RESTARTS   AGE
pod/grafana-7c4b6ccb8-q2qsv   1/1     Running   0          110m

NAME              TYPE           CLUSTER-IP      EXTERNAL-IP   PORT(S)        AGE
service/grafana   LoadBalancer   10.100.159.35   <pending>     80:31114/TCP   110m

NAME                      READY   UP-TO-DATE   AVAILABLE   AGE
deployment.apps/grafana   1/1     1            1           110m

NAME                                DESIRED   CURRENT   READY   AGE
replicaset.apps/grafana-7c4b6ccb8   1         1         1       110m
2.5. Connect and login to Grafana
In a production deployment, Grafana would typically be exposed via an Application Load Balancer, configured with a domain name and an SSL certificate. For this lab we are using a classic lod balancer and traffic is over HTTP.
To get your Grafana URL, execute:
export LB=$(kubectl -n grafana get svc grafana -o json | jq -r .status.loadBalancer.ingress[].hostname)

echo "Your Grafana URL is:"
echo "http://${LB}"
Open the Grafana URL. It may take a few minutes for the Grafana URL to become active. When the load balancer is provisioned and its DNS record has propagated, you will see the Grafana login screen. Note that DNS record propagation may take about 5 minutes. Refresh the page periodically until you see the Grafana login.
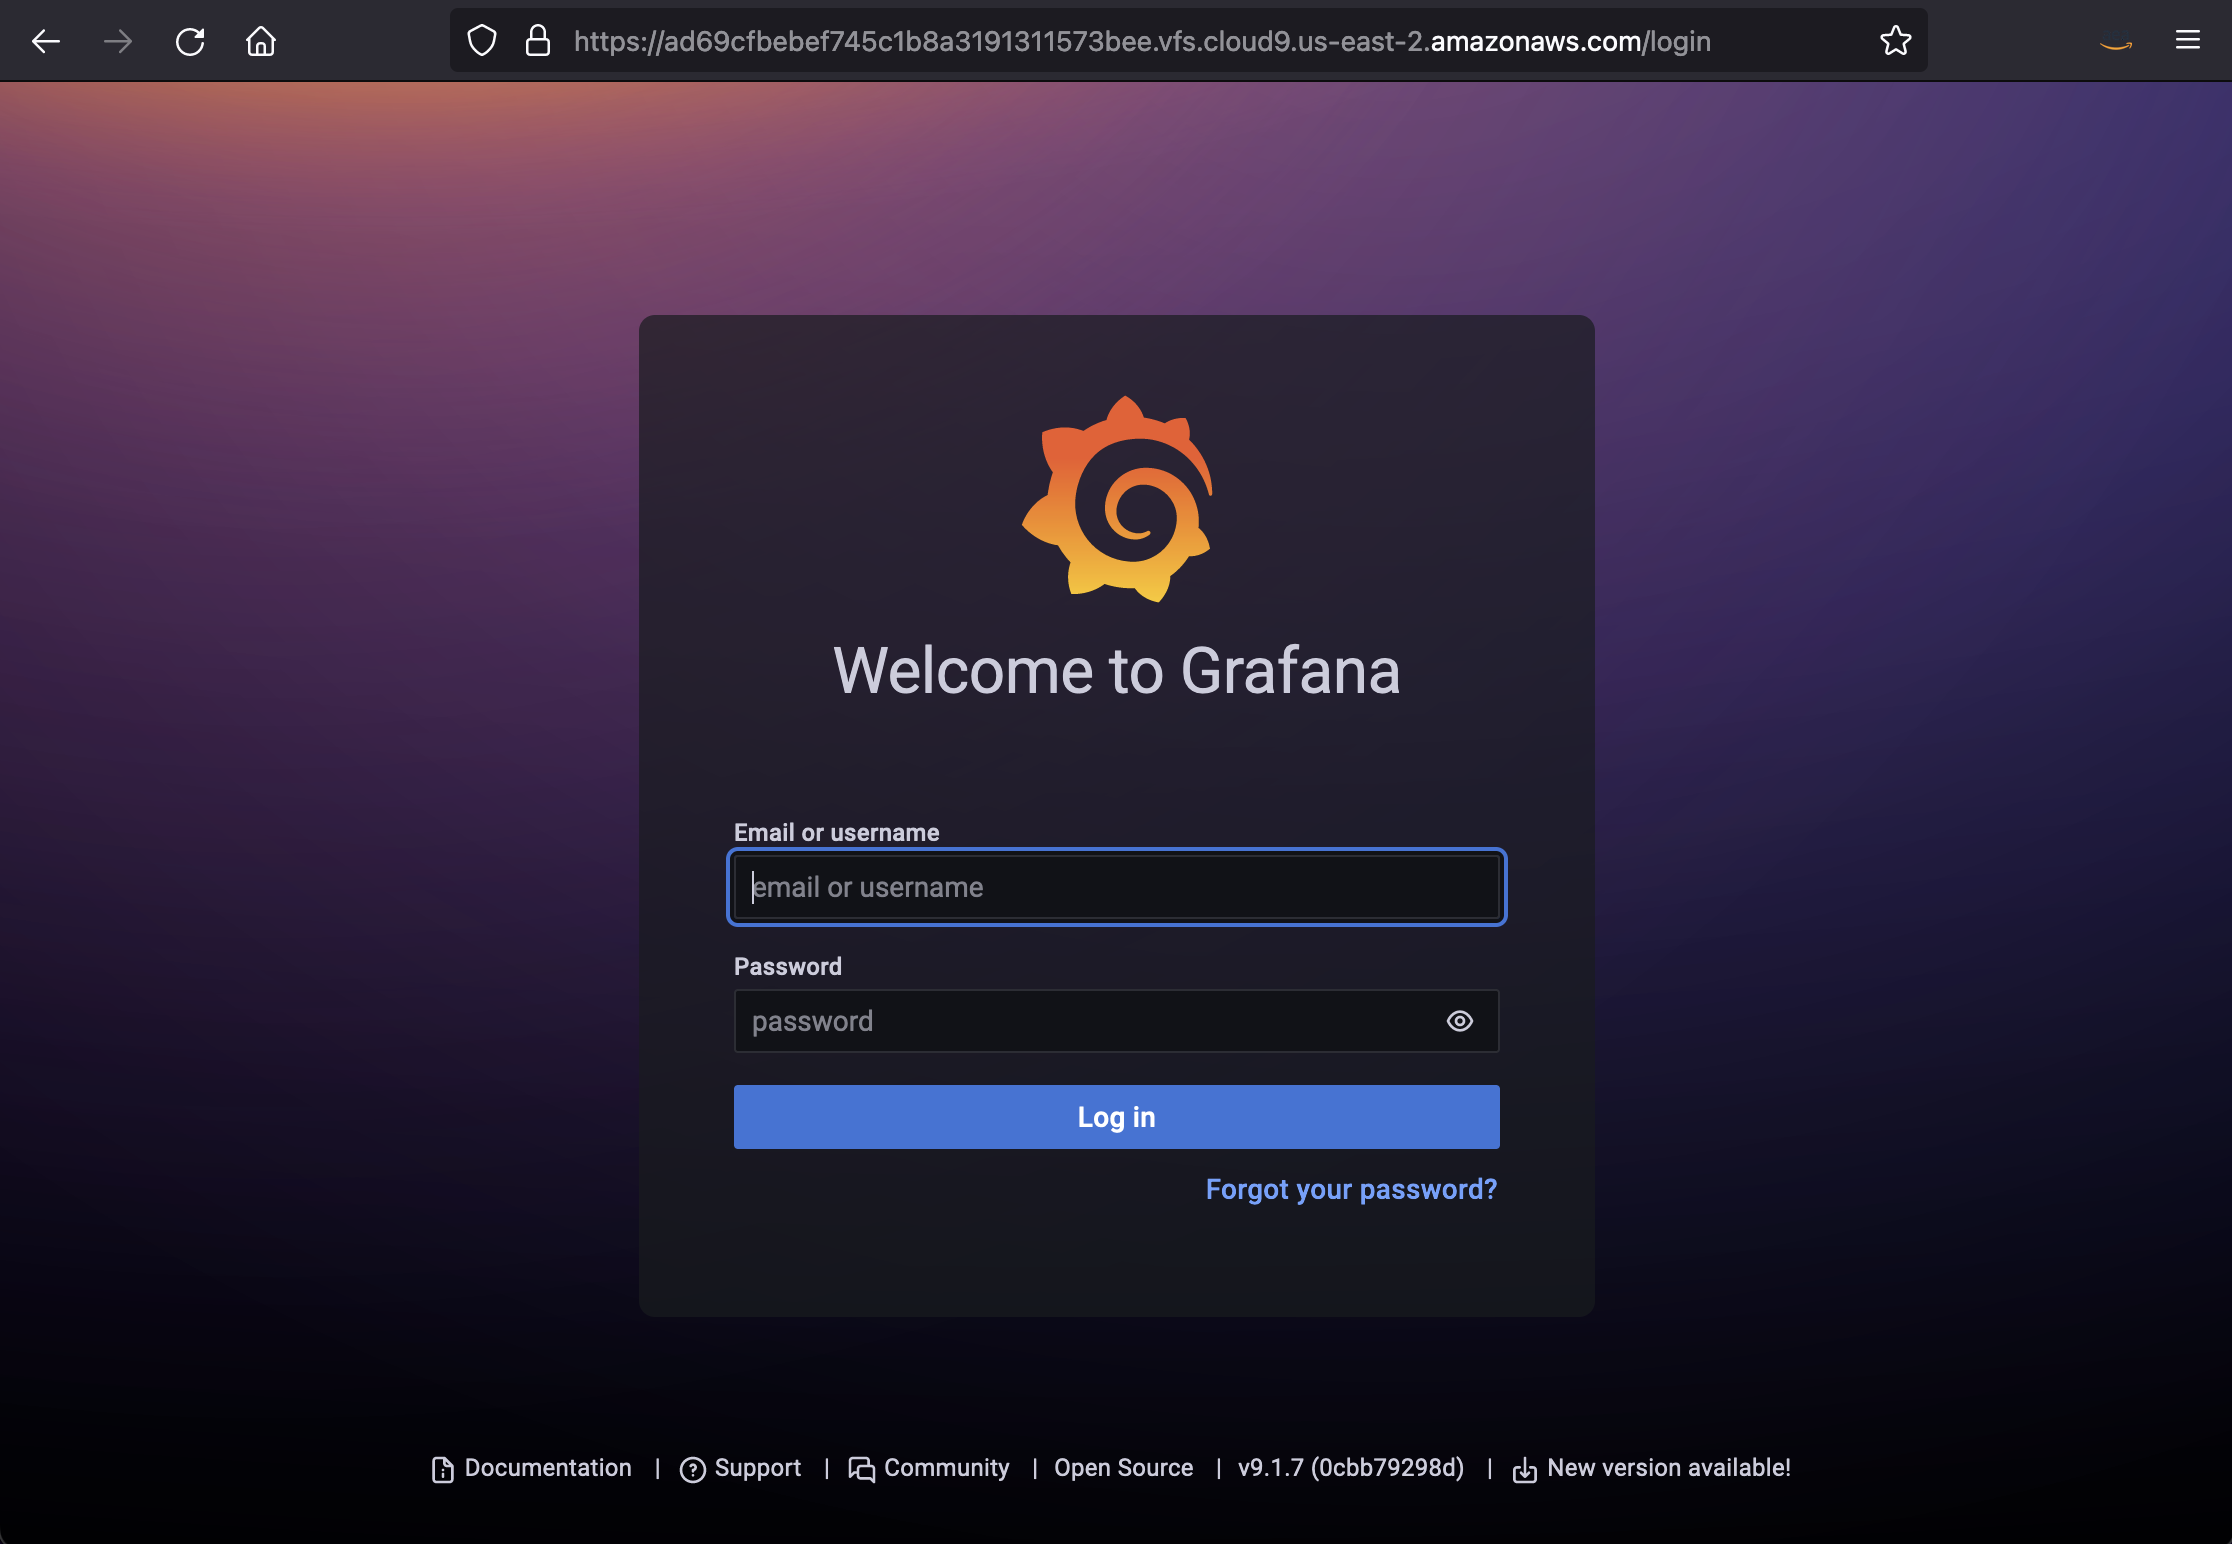
Login as user admin
To obtain the password, execute the following command:
kubectl get secret --namespace grafana grafana -o jsonpath="{.data.admin-password}" | base64 --decode ; echo
2.6. Open dashboards
We will import two standard dashboards from Grafana.com
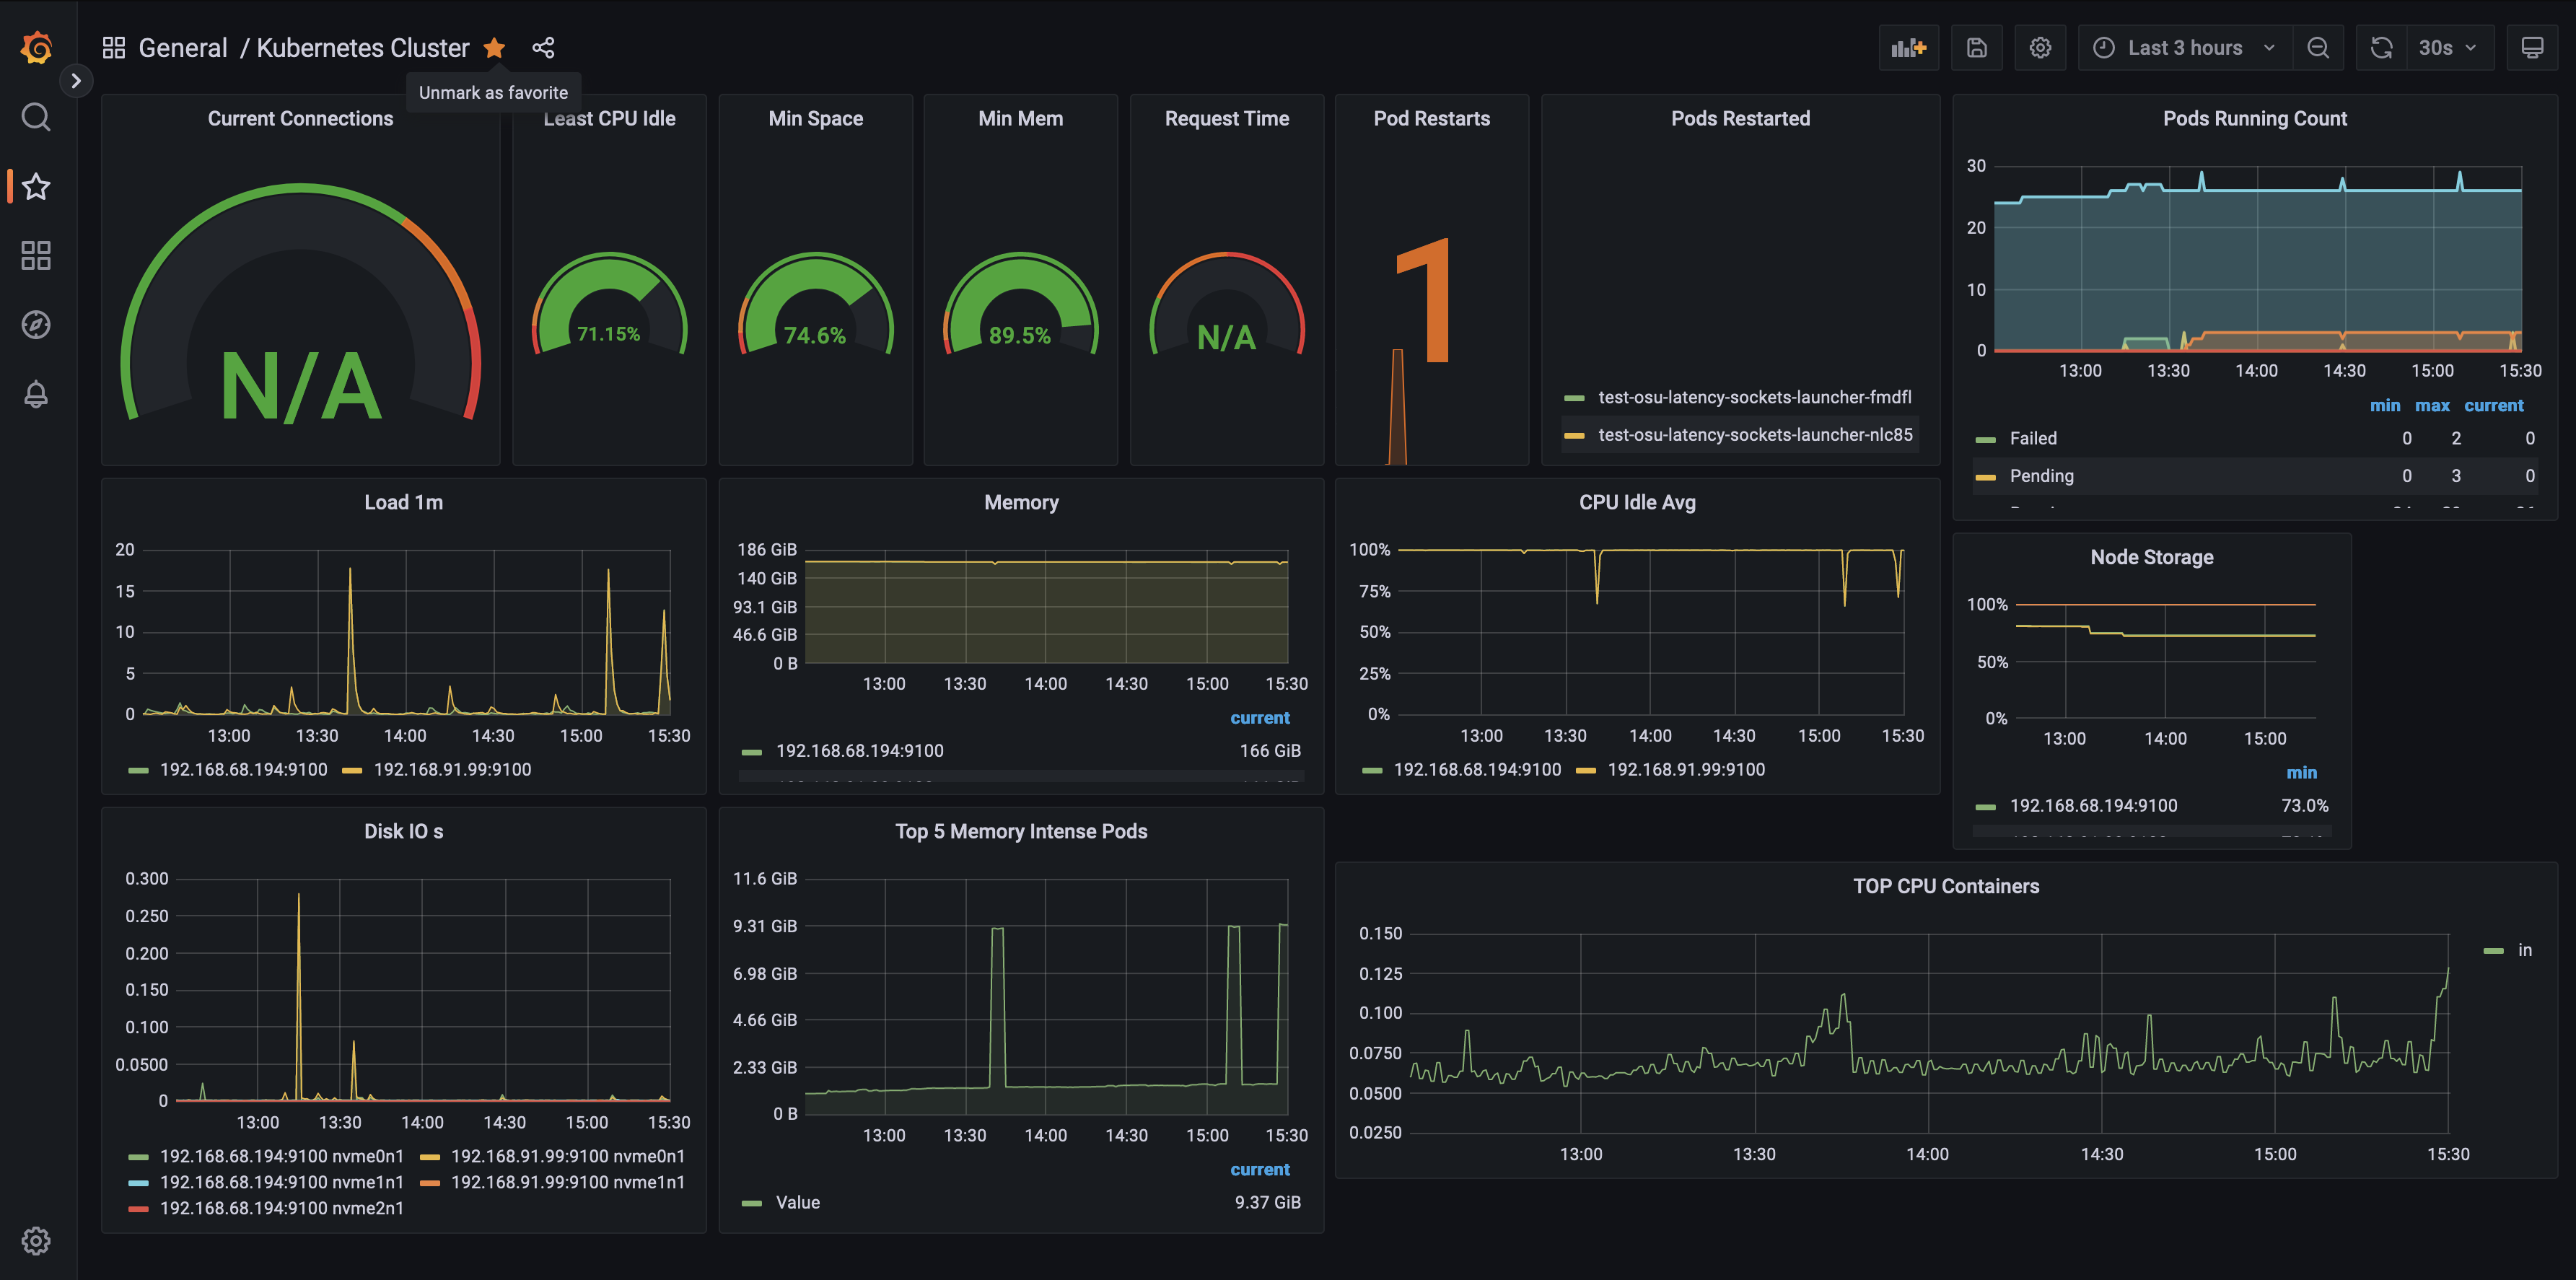
2.6.1. Cluster Monitoring Dashboard
- Click on Dashboards->Import
- Enter dashboard id
7249under Grafana.com Dashboard - Click ‘Load’
- Select ‘Prometheus’ as the endpoint under the “Prometheus data sources” drop down
- Click ‘Import’
You will see a Cluster monitoring dashboard similar to the one below:
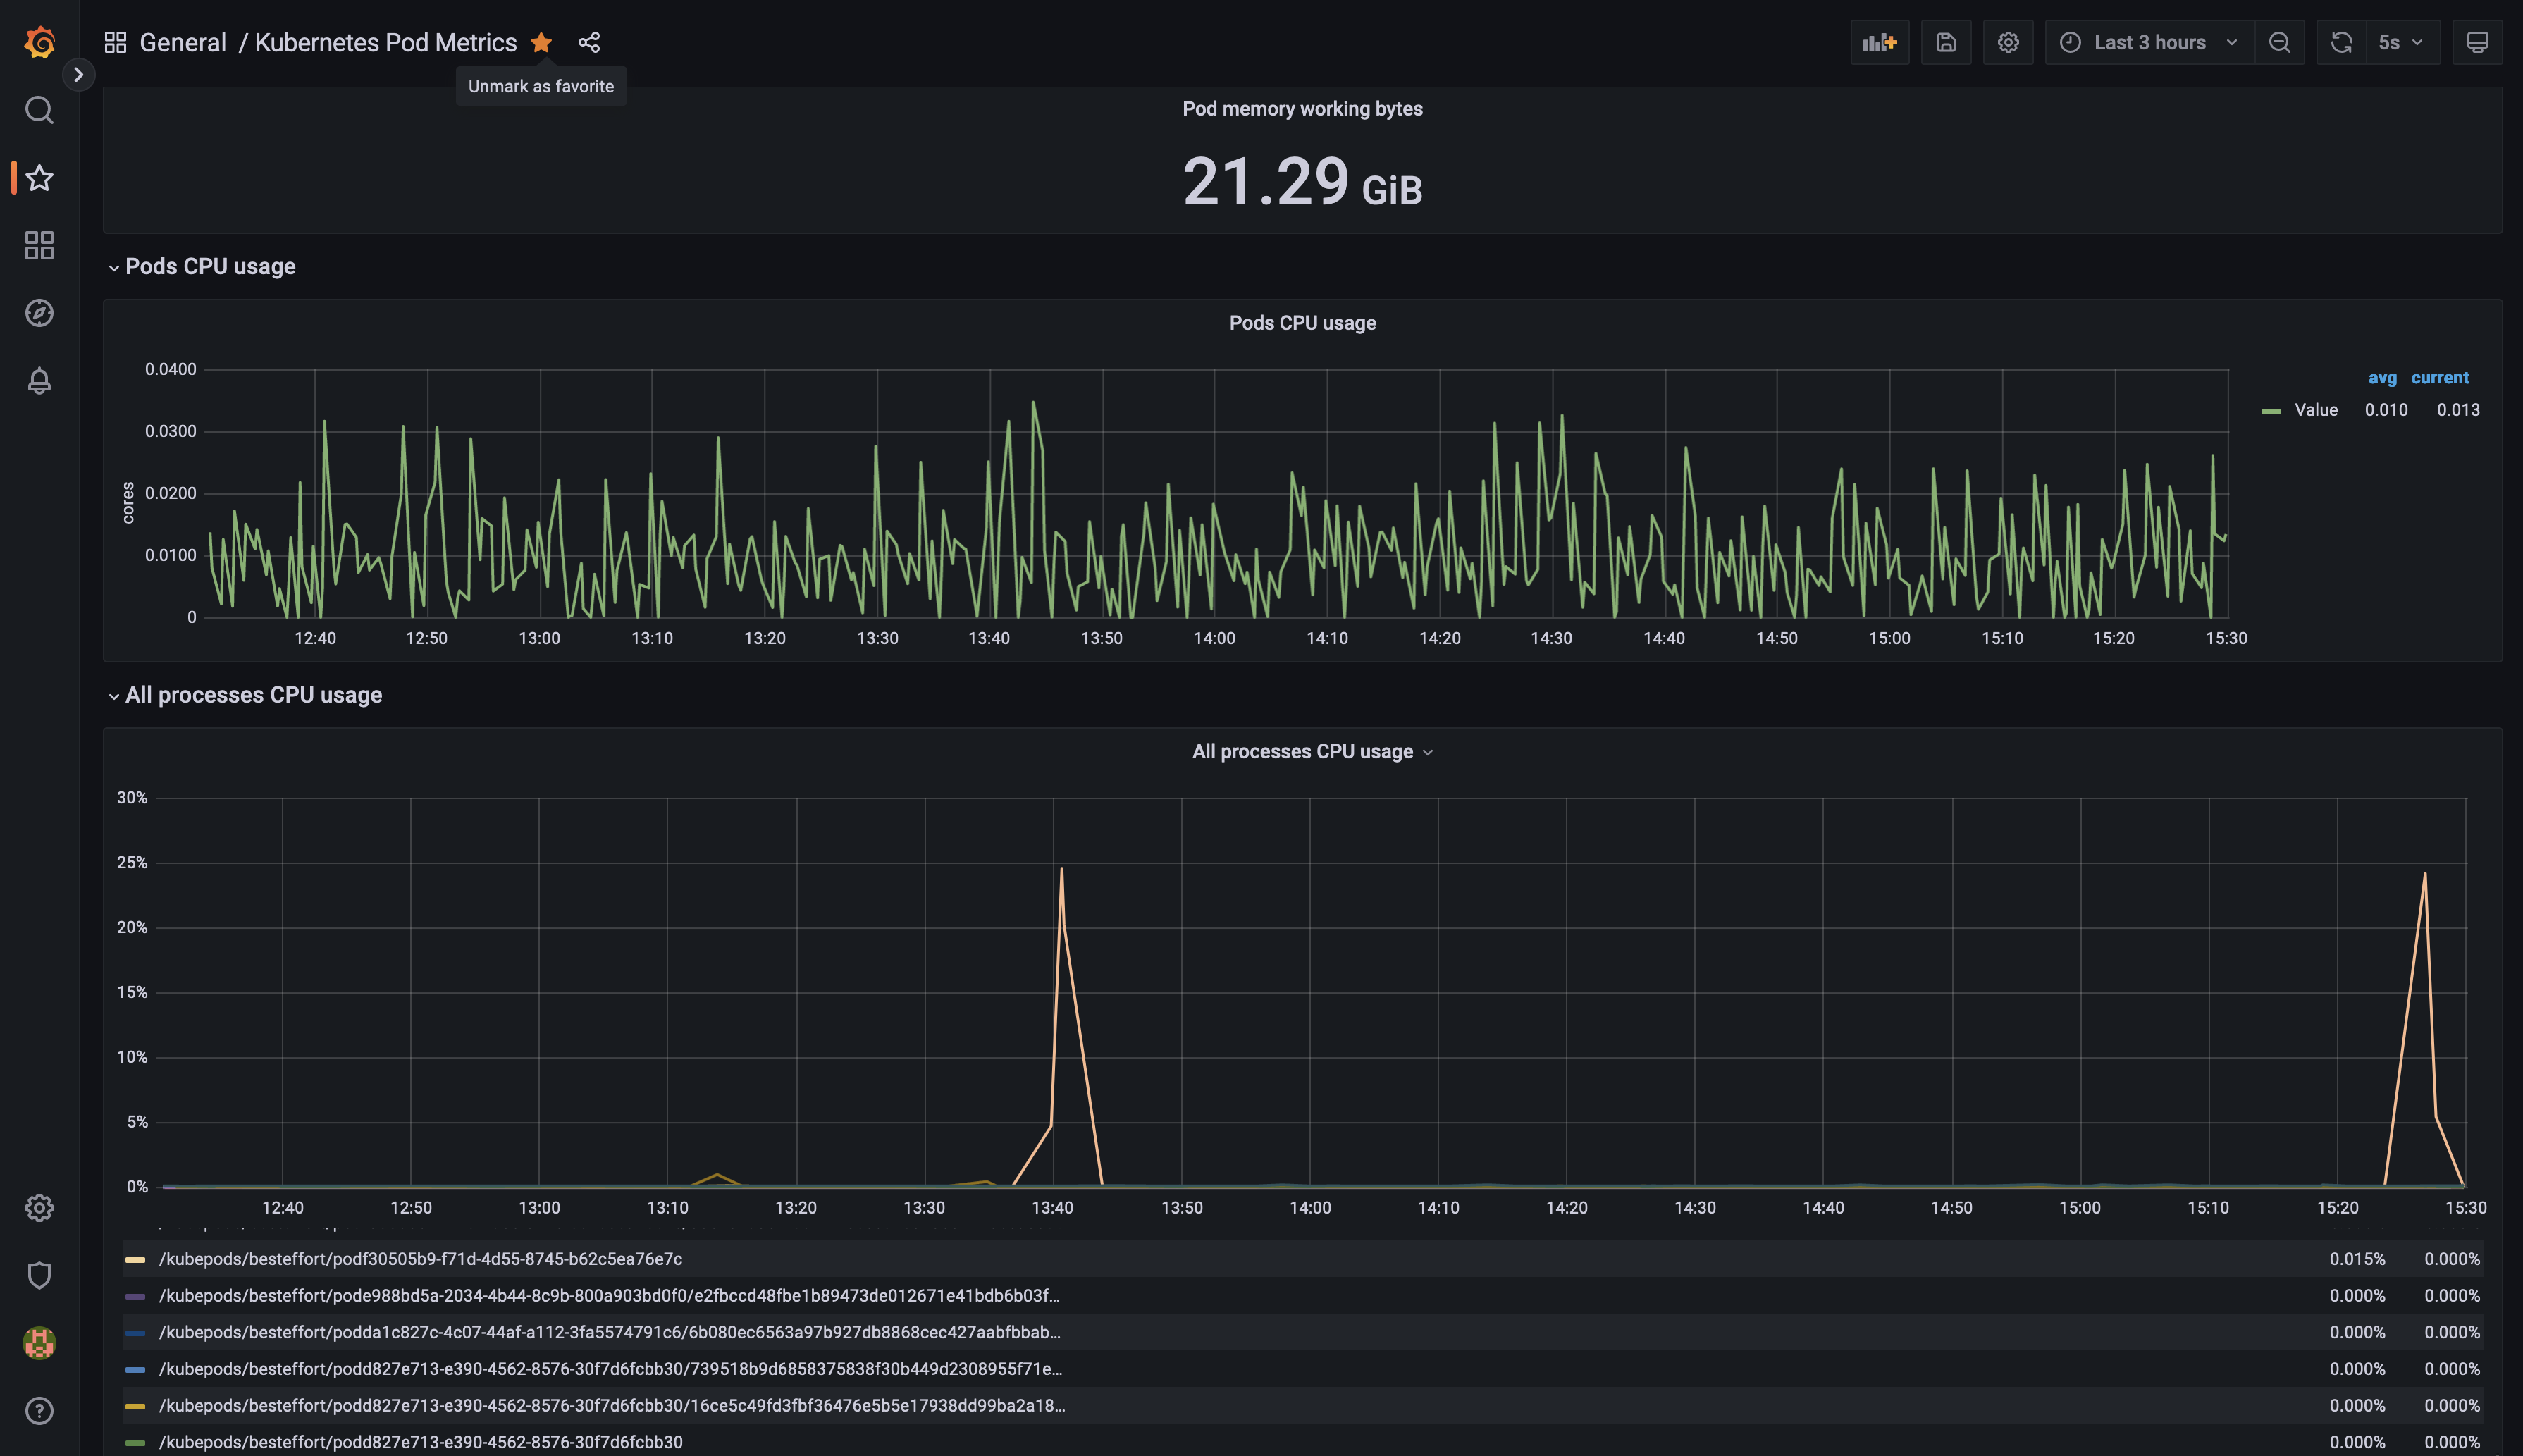
2.6.2. Pod Monitoring Dashboard
- Click on Dashboards->Import
- Enter dashboard id
747under Grafana.com Dashboard - Click ‘Load’
- Select ‘Prometheus’ as the endpoint under the “Prometheus data sources” drop down
- Click ‘Import’
You will see a Pod monitoring dashboard similar to the one below: