g. Run GROMACS MPI job
In this section, you will run a Gromacs MPI job distributed between two c5n.18xlarge nodes in your Kubernetes cluster.
1. Create MPIJob manifest
Execute the code block below to create a file named gromacs-mpi.yaml, containing an MPIJob manifest:
cat > ~/environment/gromacs-mpi.yaml << EOF
apiVersion: kubeflow.org/v2beta1
kind: MPIJob
metadata:
  name: gromacs-mpi
  namespace: gromacs
spec:
  slotsPerWorker: 48
  runPolicy:
    cleanPodPolicy: Running
  mpiReplicaSpecs:
    Launcher:
      replicas: 1
      template:
         spec:
          restartPolicy: OnFailure
          volumes:
          - name: cache-volume
            emptyDir:
              medium: Memory
              sizeLimit: 2048Mi
          - name: data
            persistentVolumeClaim:
              claimName: fsx-pvc
          initContainers:
          - image: "${IMAGE_URI}"
            name: init
            command: ["sh", "-c", "cp /inputs/* /data; sleep 5"]
            volumeMounts:
            - name: data
              mountPath: /data
          containers:
          - image: "${IMAGE_URI}"
            imagePullPolicy: Always
            name: gromacs-mpi-launcher
            volumeMounts:
            - name: cache-volume
              mountPath: /dev/shm
            - name: data
              mountPath: /data
            env:
            - name: OMPI_MCA_verbose
              value: "1"
            command:
            - /opt/view/bin/mpirun
            - --allow-run-as-root
            - --oversubscribe
            - -x
            - FI_LOG_LEVEL=warn
            - -x
            - FI_PROVIDER=shm,sockets
            - -np
            - "48"
            - -npernode
            - "48"
            - --bind-to
            - "core"
            - /opt/view/bin/gmx_mpi
            - mdrun
            - -ntomp
            - "1"
            - -deffnm
            - "/data/md_0_1"
            - -s
            - "/data/md_0_1.tpr"
    Worker:
      replicas: 1
      template:
        spec:
          volumes:
          - name: cache-volume
            emptyDir:
              medium: Memory
              sizeLimit: 2048Mi
          - name: data
            persistentVolumeClaim:
              claimName: fsx-pvc
          containers:
          - image: "${IMAGE_URI}"
            imagePullPolicy: Always
            name: gromacs-mpi-worker
            volumeMounts:
            - name: cache-volume
              mountPath: /dev/shm
            - name: data
              mountPath: /data
            resources:
              limits:
                memory: 8000Mi
              requests:
                memory: 8000Mi
EOF
2. Run the GROMACS MPIJob
To launch the GROMACS MPIJob, execute:
kubectl apply -f ~/environment/gromacs-mpi.yaml
Watch the pods in the gromacs namespace until the launcher pod enters Running state.
kubectl get pods -n gromacs -w
Press Ctrl-c to exit.
Follow the launcher logs while the pod is in Running state.
kubectl -n gromacs logs -f $(kubectl -n gromacs get pods | grep gromacs-mpi-launcher | head -n 1 | cut -d ' ' -f 1)
You should see GROMACS log entries similar to the ones shown below. Job output will hang on the line 50000 steps, 100.0 ps. while the simulation runs and will report the rest on simulation completion.
...
50000 steps,    100.0 ps.

Writing final coordinates.


Dynamic load balancing report:
 DLB was off during the run due to low measured imbalance.
 Average load imbalance: 24.7%.
 The balanceable part of the MD step is 56%, load imbalance is computed from this.
 Part of the total run time spent waiting due to load imbalance: 13.8%.
 Average PME mesh/force load: 1.091
 Part of the total run time spent waiting due to PP/PME imbalance: 4.6 %

NOTE: 13.8 % of the available CPU time was lost due to load imbalance
      in the domain decomposition.
      Dynamic load balancing was automatically disabled, but it might be beneficial to manually tuning it on (option -dlb on.)
      You can also consider manually changing the decomposition (option -dd);
      e.g. by using fewer domains along the box dimension in which there is
      considerable inhomogeneity in the simulated system.

               Core t (s)   Wall t (s)        (%)
       Time:     2971.865       41.276     7199.9
                 (ns/day)    (hour/ns)
Performance:      209.325        0.115
Press Ctrl-c to stop following the log.
While waiting for the GROMACS MPIJob to complete, explore the cluster utilization using either kubectl top node or the Grafana dashboards.
Example:
kubectl top node
Output:
NAME                                            CPU(cores)   CPU%   MEMORY(bytes)   MEMORY%
ip-192-168-86-187.ec2.internal                  36114m       37%    5275Mi          1%
You should notice increased utilization of the cluster node cores. This is an indication that the MPI Job is running.
3. Delete MPIJob when completed
To delete the GROMACS MPIJob, after it is completed, execute:
kubectl delete -f ~/environment/gromacs-mpi.yaml
4. Check output files in FSx volume
Congratulations, you have successfully run a tightly coupled MPI job on two nodes using GROMACS to simulate a protein (lysozyme) in a box of water with ions.
Once the job is completed the output files are in the FSx volume. To check that we will mount the volume in a new pod and open a shell in that pod.
Execute the code below to create a file named fsx-data.yaml, containing the pod manifest.
cat > ~/environment/fsx-data.yaml << EOF
apiVersion: v1
kind: Pod
metadata:
  name: fsx-data
  namespace: gromacs
spec:
  containers:
  - name: app
    image: amazonlinux:2
    command: ["/bin/sh"]
    args: ["-c", "while true; do date; sleep 5; done"]
    volumeMounts:
    - name: data
      mountPath: /data
  volumes:
  - name: data
    persistentVolumeClaim:
      claimName: fsx-pvc
EOF
Create the pod.
kubectl apply -f ~/environment/fsx-data.yaml
Check the pod status.
kubectl -n gromacs get pods
Once the pod is in Running state, open a shell into it.
kubectl -n gromacs exec -it $(kubectl -n gromacs get pods | grep fsx-data | head -n 1 | cut -d ' ' -f 1) -- bash
Describe the volumes mounted in the pod
df -h
Output:
Filesystem                     Size  Used Avail Use% Mounted on
overlay                         30G  6.7G   24G  23% /
tmpfs                           64M     0   64M   0% /dev
tmpfs                          185G     0  185G   0% /sys/fs/cgroup
192.168.106.172@tcp:/aqbp5bmv  1.1T   16M  1.1T   1% /data
/dev/nvme0n1p1                  30G  6.7G   24G  23% /etc/hosts
shm                             64M     0   64M   0% /dev/shm
tmpfs                          185G   12K  185G   1% /run/secrets/kubernetes.io/serviceaccount
tmpfs                          185G     0  185G   0% /proc/acpi
tmpfs                          185G     0  185G   0% /sys/firmware
Notice the FSx volume is mounted under /data.
Check that the output data from the Gromacs MPI job is in the /data directory.
ls -alh /data
You should see a list of files like the one below:
...
total 9.4M
drwxr-xr-x 3 root root  33K Sep 30 04:29 .
drwxr-xr-x 1 root root   29 Sep 30 04:34 ..
-rw-r--r-- 1 root root 797K Sep 30 04:29 md_0_1.cpt
-rw-r--r-- 1 root root 8.2K Sep 30 04:29 md_0_1.edr
-rw-r--r-- 1 root root 2.3M Sep 30 04:29 md_0_1.gro
-rw-r--r-- 1 root root  36K Sep 30 04:29 md_0_1.log
-rw-r--r-- 1 root root 1.3M Sep 30 04:29 md_0_1.xtc
These are the files that the GROMACS simulations produced:
md_0_1.logcontains the GROMACS run output logs (open it up and inspect).md_0_1.grocontains the encoded protein structure.md_0_1.xtccontains particle trajectory information.md_0_1.edrcontains information about physical quantities, like energy, temperature, and pressure.md_0_1*.cptcontains checkpoint/restore data (can be used to resume the simulation).
When you are done inspecting the data files, exit the data pod shell.
exit
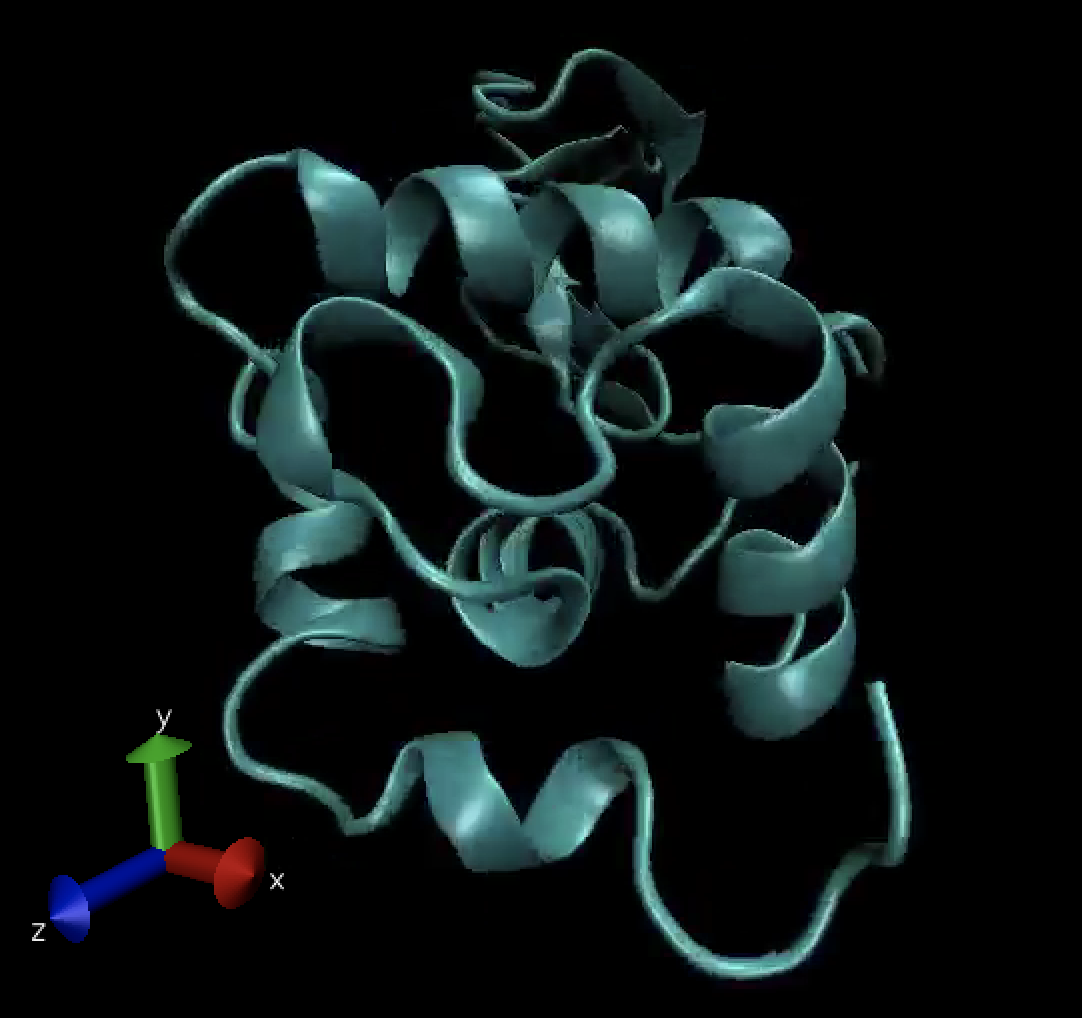
If the output data is copied to a linux desktop, it can be visualized with the VMD tool by using the following command (not covered here):
/usr/local/bin/vmd md_0_1.gro md_0_1.xtc
Visualized, the output looks like the image below and can be displayed as a movie over time: